the problem
an automotive company wanted to expand into new markets with its existing product lineup. in its current market it had grouped customers into four segments (a, b, c, d) and run tailored outreach for each with great success. the task was to predict the right segment for 2,627 prospects in the new market so the same strategy could be applied.
the challenge: missing data
the dataset (kaggle, ~8,000 customers, 11 features) had missing values in 60% of its features and 17.4% of its rows - too much to simply drop. handling this cleanly became the core of the project.
i compared four imputation methods: mean, knn, and two optimisation-based approaches (opt-knn and opt-svm) from bertsimas et al. each imputed dataset was evaluated by training a model and measuring validation accuracy.
modelling
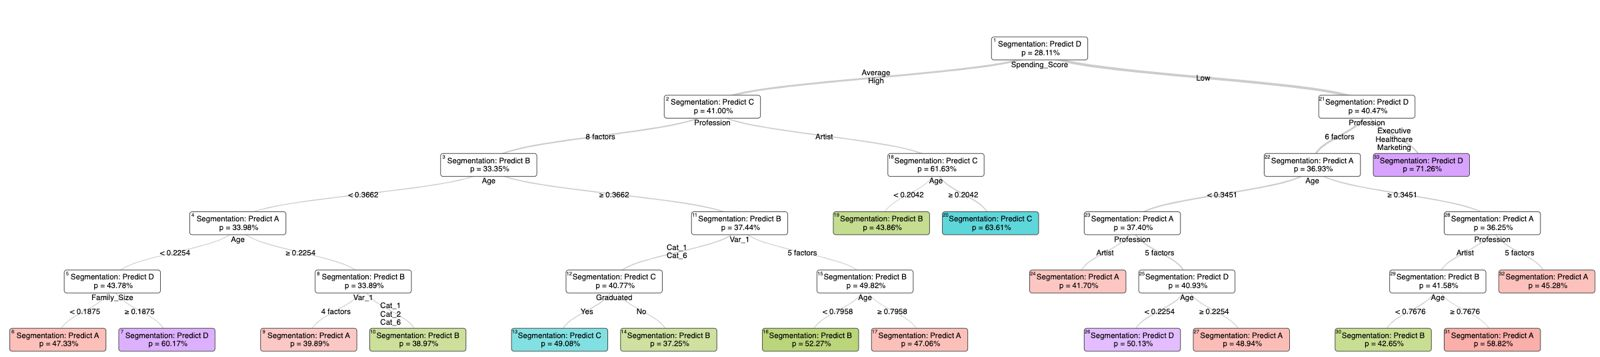
after min-max scaling and encoding the categorical features, i trained logistic regression, random forest, xgboost, cart, and an optimal classification tree (oct), benchmarked against a baseline that predicts the most common segment. i handled the data pre-processing and the majority of the modelling.
| model | accuracy |
|---|---|
| baseline (most common) | 0.278 |
| logistic regression | 0.527 |
| random forest | 0.632 |
| xgboost | 0.569 |
| optimal classification tree | 0.545 |
what drives a segment
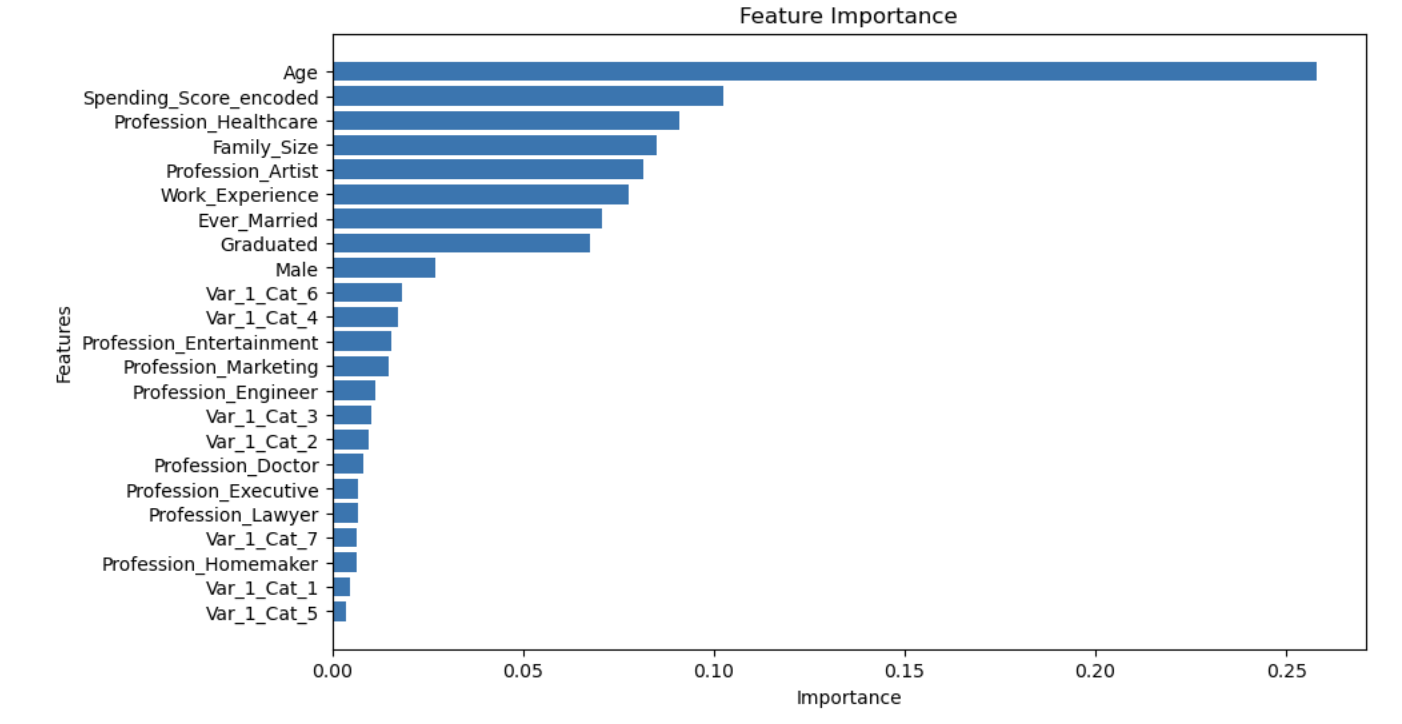
random forest paired with opt-knn imputation performed best, improving on the baseline by 127%. feature importance and shap pointed to age, spending score, and profession as the strongest segment drivers.
interpretable segments
the optimal classification tree gave an interpretable view the company could act on directly: spending score splits customers at the top level, with profession and age as the next discriminators. for example, segment a skews to older high-spenders and executives, while segment d captures younger low-spenders and high-spending healthcare or executive roles.